Showing posts with label Tips. Show all posts

Friday, April 6, 2018

Grouping Values Together

Sometimes, you want values grouped together. For example, rather than displaying individual ages, such as 25, 26, 27, and so on, you want them grouped, such as "Under 20," "20 - 29," "30 - 39," and so on. To do that, create a formula using an ICASE statement that determines what to display if the value falls into a certain group. For example:

ICASE(Student.Age < 20, " Under 20",
Student.Age < 30, "20 - 29",
Student.Age < 40, "30 - 39",
"40 +")

Note the space at the start of " Under 20"; this ensures it sorts before "20 - 29". Because the expression checks for the numbers from lowest to highest, it doesn’t have to check for ranges such as BETWEEN(Student.Age, 20, 29); the earlier comparison eliminated lesser values. Also notice there is no final condition: that means “any other values”, which is displayed as “40+”.

Here's another example: this groups car manufacturer by country:

ICASE(INLIST(Auto.Make, "Ford", "GM"), "U.S.",
INLIST(Auto.Make, "BMW", "Volkswagen"), "Germany",
"Other")

Note that if there are a lot of groups or a lot of values in each group, the expression may be longer than 255 characters, which is the maximum length of an expression. In that case, create a function that does the work and call the function from the formula. For example, here is the expression for a formula handling age groups:

GetAgeGroup(Student.Age)

Here is the code for that function:

lparameters tnAge
do case
    case tnAge < 20
        return " Under 20"
    case tnAge < 30
        return "20 - 29"
    case tnAge < 40
        return "30 - 39"
    case tnAge < 50
        return "40 - 49"
    case tnAge < 60
        return "50 - 59"
     case tnAge < 70
        return "60 - 69"
    case tnAge < 80
        return "70 - 79"
    case tnAge < 90
        return "80 - 89"
    otherwise
        return "90+"
endcase

Tuesday, January 30, 2018

Calculating Profit Margin and Other Expressions with Division

An expression that does division, such as calculating profit margin, is trickier than it looks. The problem is how do you calculate a group or end-of-report value?

For example, you can create a formula to calculate the profit margin of an item using something like "(SaleAmount - Cost)/SaleAmount * 100." That expression works correctly for detail items but not for groups. Suppose an invoice has one item sold for $2.00 that you paid $1.00 for (a 50% margin) and another item for $20.00 that you paid $15.00 for (a 25% margin). The total sale amount for the invoice is $22.00 and the total cost of the items is $16.00 for an overall margin of 27%. For a group footer for that invoice, you clearly can't sum the margins (25 + 50 = 75%), nor can you average them ((25 + 50)/2 = 37.5%). What you really need the report to do is to total the sales amounts, total the cost amounts, and then calculate the margin at the group level from those totals.

Fortunately, Stonefield Query has a way to do that: formulas with group level recalculation. See the help topic for “Creating Your Own Formulas” for a discussion of how to use that feature.

If you’re doing the calculations manually in the Advanced Report Designer rather than with formulas, you need to calculate the margin with variables. In the Advanced Report Designer, choose Variables from the Report menu, click Add, enter a name such as GroupPrice, and use these settings:

Value to store: the name of the field containing the price, such as EXTPRICE
Initial value: 0
Reset value: choose which group to restart the calculation on
Calculation type: Sum

This tells Stonefield Query to sum up the price field at the group level. Create another variable named TotalPrice with the same settings but Reset Value should be Report so it sums the price field for the whole report.

Create two more variables, GroupCost and TotalCost, that are similar but use the name of the cost field instead.

Finally, use these variables in fields in the Group Footer band and Summary band to display the overall margin. For example, for the one in the Group Footer band, use:

iif(GroupPrice = 0, 0, (GroupPrice - GroupCost) / GroupPrice * 100)

That way, the calculation is done the same way you'd do it by hand: total up the price, total up the cost, and do the calculation on the totals.

Thursday, April 16, 2015

Creating an Aging Report Using Stonefield Query

An aging report is one that shows totals broken down by age range. The most common example is an accounts receivable aging report, which shows how much each customer owes by period, typically within the past 30 days, 31 – 60 days, 61 – 90 days, and over 90 days. This type of report allows you to make business decisions, such as which customers to increase collection efforts with and which to cut off sales until they pay up (no point in continuing to sell products or do work for customers who won’t pay for them).

aging

You’ve always been able to create this type of report in Stonefield Query, but until version 5.0, it was a bit of work. There were two ways to do it:

  • Create a formula for each aging range that decides whether to include the amount or not using the IIF function that checks the date. For example, the expression IIF(BETWEEN(Invoices.DateDue, DATE(), DATE() – 30), Invoices.OutstandingAmount, 0) checks whether the due date for the invoice is between the current date and 30 days ago. If so, it takes the unpaid amount; if not, it takes 0. The report is grouped on customer and the formula fields are summed.
  • Using the Advanced Report Designer, add fields to the report that do similar calculations to the formula approach.

A better way

A new feature added in version 5.0 called grouping formulas makes this a much simpler task. Here are the steps to creating an aging report using the sample data that comes with the Stonefield Query SDK; for other versions, such as Stonefield Query for Sage 300 ERP, the steps are very similar but you use the appropriate tables and fields instead of the ones mentioned here.

The first step is to create a quick report. Add the Customer Name field to the report, then click the New Formula button. Select the Customers table because that’s where we want the formula to go. Enter “0 – 30” for the Name and Heading since this first formula is for the first aging. Click the Expression Builder button (the one with the three dots) and select the Total Price field from the Order Details table because that’s the field we want to sum up.
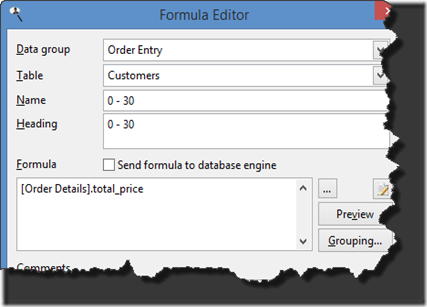
formula1

Now here’s the key: we want this to be a grouping formula. A grouping formula is similar to a regular formula but it automatically summarizes the values, grouping on a certain field, and optionally for only a certain range of records. (Those of you who are technically oriented may guess that a grouping formula results in a SQL statement like SELECT SUM(SomeField) FROM SomeTable WHERE SomeConditions GROUP BY SomeGroupField.) In our case, we want to sum the total price, group the sums by customer, and only for records that are 30 or fewer days old. (Since the sample database doesn't have payments, we'll just assume that all orders are outstanding for demo purposes.)

To make this a grouping formula, click the Grouping button. Select Sum for Summary and Customer ID for Grouping Field. Click the Filter button, add a condition, select the Order Date field from the Orders table, and choose “is between” for the operator. The values to use are a little tricky: we don’t want to hard-code them to something like 05/01/2015 and 05/31/2015 because every time we run the report, we’d have to edit the formula and change the date range. We could turn on Ask at Runtime to prompt for the date range, but since we’ll ultimately have four formulas (one for each aging range), we don’t want to be asked for four different ranges of values; we really just want to put in a single value, which is the “as of” date for the aging calculations. To do that, click the More button, change Compare To to “Expression”, and enter the following expressions for the two values:

GetValueForParameter('As of date', 'D') – 30
(for the first value)

GetValueForParameter('As of date', 'D')
(for the second one)

GetValueForParameter is a built-in function that asks the user running the report for a value. The first parameter for the function is the text to display (“As of date” in this case) and the second is the data type for the value (“D” means we want a date; see the documentation for GetValueForParameter for what codes to use for different data types). The first expression tells Stonefield Query to ask the user for a date value and then subtract 30 days from that value. You may think from the second expression that Stonefield Query asks the user a second time, but GetValueForParameter has a nice feature: if the prompt is the same as a previous instance, the function doesn’t ask the user a second time but instead just returns the value they entered when they were asked. Since the two expressions both use “As of date” for the prompt, the user is asked only once. In fact, you’ll use a similar expression for the other formulas, such as 31 – 60, but subtract a different number of days, and since all of them use “As of date” for the prompt, the user is still only asked one time for the value that all expressions use.

Once you’ve saved the filter condition, the Grouping Formula Properties dialog should look like this:

formula2

Specify the formatting for the formula (I turned on Display $ and set Decimal Places to 2) and save the formula.

Finishing the report

Repeat these steps to create the 31 – 60, 61 – 90, and More Than 90 formulas. The only difference is the expressions used for the filter condition. For example:

GetValueForParameter('As of date', 'D') – 60
(first value for 31 – 60 formula)

GetValueForParameter('As of date', 'D') – 31
(second value for 31 – 60 formula)

(The expressions to use for the other two formulas are left as an exercise for the reader, but should be pretty obvious).

That’s it! Your report should now include Customer Name and the four formulas. No need to group the report on Customer Name or turn on Summary Report. When you run the report, you’re asked for the date to use for the aging calculations. The result should look like this:
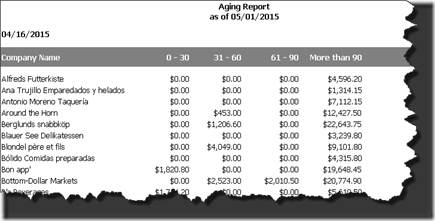
aging

Summary

Grouping formulas are a very powerful new feature added in version 5.0 of Stonefield Query. There are tons of uses for them, one of them making it very easy to create a simple aging report.

Thursday, April 9, 2015

Finding the Fields You Need for a Report

If there are a lot of fields in your database, it can be challenging to find the one you're looking for. Here are some tips that may help:

  • If you're not sure what a field contains, click the Values button in step 2 of the report wizards. The different values displayed in the dialog often give a clue as to what the field is used for.
  • Fields are displayed by default in alphabetical order. This makes it easy to find a field in the list. However, sometimes it makes more sense to display fields in the order they appear in the table. Click the SORTASCXPSMALL button to display fields in table order.
  • A long list of fields can make it difficult to find the ones you're interested in. If you know part of the field caption you're looking for (such as a field with "tax" somewhere in the caption), click the findxpsmall button, enter the text, and click OK. If there are any fields that match, the first one is selected. Press F3 to find the next one containing the same text.
  • A long list of tables can make it difficult to find the ones you're interested in. Once you've selected fields from one table, chances are you're next going to select fields from a directly-related table. For example, if you chose a field from Customers, you are more likely to choose a field from Orders than from Products. Click the RELATIONXPSMALL button to reduce the list of tables to only those directly related to ones you've already selected fields from.
  • If you're familiar with the name of your application's tables and fields, you might find it easier to locate the tables and fields you want by their real names. Turn on the Display real table and field names option in the Options dialog to display the real name followed by the descriptive name in parentheses.
  • Sometimes the fields in an application are organized into pairs of "header-detail" tables; invoices and invoice lines is a classic example. These are called "header-detail" pairs because the information displayed in the header or top of an invoice goes in the invoices table and the line items go in the invoice lines table. When looking for a particular field, ask yourself if there's only one of these things in the invoice (invoice number, invoice date, customer number, and so on) or if there can be more than one (product description, quantity sold, etc.). If there's only one, you'll find the field in the header (in this case, invoice) table. If there's more than one, it'll be in the detail (invoice lines in this example) table.
  • Application view shows fields the way your application does in its various dialogs. However, not all fields may appear when Application view is turned on in step 2. If you can't find a particular field, try turning on Database view. (Your version of Stonefield Query may not support application view.)
  • A lot of fields may contain default or even no data; for example, the fields may be there to support certain features in the program, but you may not use those features. To hide those fields, choose Analyze Database from the Tools menu. This function goes through your database, looking at all fields in all tables for fields containing meaningful data (that is, more than a single unique value), and marking those as "favorite." After you've run this function, step 2 in the report wizards displays a FAVORITES button. If you turn this on, the table and field lists show only those tables and fields marked as "favorites." (Your version of Stonefield Query may not support favorites.)